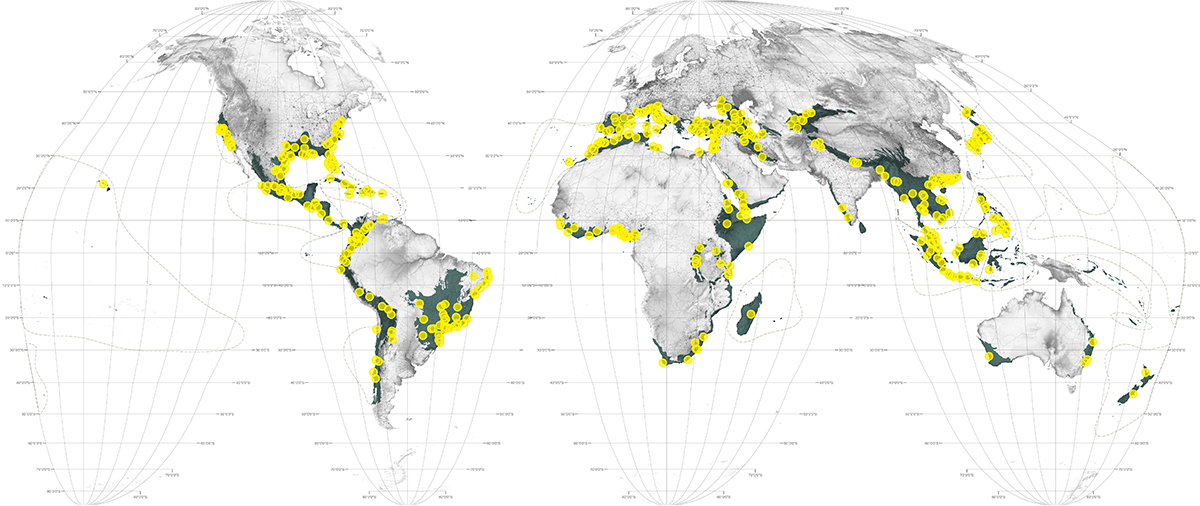
This map locates cities of 300,000 or more people projected to sprawl into remnant habitat in the world's biological hotspots. To make the map urban growth projections are overlaid on top of remnant vegetation data from the Global Land Cover Facility 1 and IUCN Red List 2 of ranges for 3,245 mammal species that are either critically endangered or endangered. Due to technical and time constraints, the research only used mammal species as a start to examine the potential conflicts that lie between immanent urban development and biodiversity. This map draws attention to places in need of urban design strategies to mitigate immanent conflict between urban development (formal and informal) and biodiversity. These cities can each be seen in greater detail in the Hotspots section.
1 Sourced from the Institute of Environment and Sustainability at the Joint Research Centre of the European Commission, 2014. https://ec.europa.eu/jrc/en/about/institutes-and-directorates/jrc-ies (accessed May 1st, 2015)
2 The IUCN Red List of Threatened Species, http://www.iucnredlist.org (accessed June 1, 2016).
1. Urban Growth
The growth area data projected out to 2030 for each city is sourced from the Seto Lab at Yale. See: Karen C. Seto, Burak Güneralp, & Lucy R. Hutyra, "Global Forecasts of Urban Expansion to 2030 and Direct Impacts on Biodiversity and Carbon Pools,"" Proceedings of the National Academy of Science of the United States 109, no. 40 (2012): 16083-16088.
2. Hotspots
Critical Ecosystem Partnership Fund, "The Biodiversity Hotspots," http://www.cepf.net/resources/hotspots/pages/default.aspx (accessed July 1, 2014). Data made available under the Creative Commons BY-SA 4.0 License: https://creativecommons.org/licenses/by-sa/4.0/legalcode.