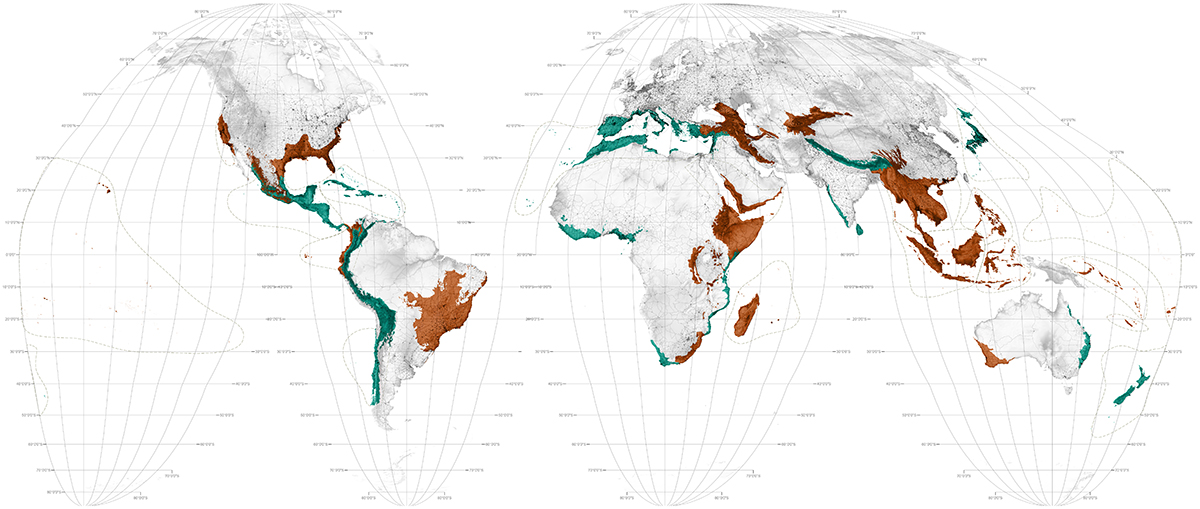
This map indicates which of the world's biological hotspots (2015 data) have reached the global Aichi target of 17% protected area (IUCN categories I-VI, plus NA lands) and which have not. Those that have are the 1) Cape Floristic Region, 2) the Caribbean Islands, 3) the Chilean Winter Rainfall Valdivian Forests, 4) the Coastal Forests of Eastern Africa, 5) the Forests of Eastern Australia, 6) the Guinean Forests of West Africa, 7) the Himalaya, 8) Japan, 9) the Mediterranean Basin, 10) Mesoamerica, 11) New Zealand, 12) the Tropical Andes, 13) the Western Ghats and Sri Lanka, and 14) the Succulent Karoo.
| HOTSPOTS RANKED ACCORDING TO PROTECTED AREA (2015 data, IUCN categories I-VI plus NA lands) | ||
| 1. New Zealand 33.4% | 19. New Caledonia 15.1% | |
| 2. Tropical Andes 23.8% | 20. Madrean Pine-oak Woodlands 14.5% | |
| 3. Cape Floristic Region 25.7% | 21. California Floristic Province 13.6% | |
| 4. Eastern Australia 23.5% | 22. Indo-Burma 13.4% | |
| 5. Succulent Karoo 22% | 23. Tumbes-Choco-Magdalena 11.9% | |
| 6. Chilean Winter Rainfall Valdivian Forests 20.3% | 24. Cerrado 11% | |
| 7. Western Ghats & Sri Lanka 20.2% | 25. Maputaland Pondoland Albany 9.7% | |
| 8. Mesoamerica 19.3% | 26. Polynesia-Micronesia 9.7% | |
| 9. Himalaya 19.2% | 27. Sundaland 9.6 % | |
| 10. Japan 19.1 % | 28. Wallacea 9.5% | |
| 11. Mediterranean Basin 19% | 29. Mountains of Central Asia 9.4% | |
| 12. Guinean Forests of West Africa 17.7% | 30. Madagascar & The Indian Ocean Islands 9% | |
| 13. Caribbean Islands 17.6% | 31. Caucasus 8.7% | |
| 14. Coastal Forests of Eastern Africa 17.6% | 32. Atlantic Forests 8% | |
| 15. Eastern Afromontane 16.8% | 33. Horn of Africa 7.7% | |
| 16. South Western Australia 16.4% | 34. Irano-Anatolian 4.8% | |
| 17. Mountains of South West China 15.8% | 35. East Melanesian Islands 2% | |
| 18. Philippines 15.2% | ||
| HOTSPOTS RANKED ACCORDING TO PROTECTED AREA (2015 data, IUCN categories I-VI plus NA lands) |
| 1. New Zealand 33.4% |
| 2. Tropical Andes 23.8% |
| 3. Cape Floristic Region 25.7% |
| 4. Eastern Australia 23.5% |
| 5. Succulent Karoo 22% |
| 6. Chilean Winter Rainfall Valdivian Forests 20.3% |
| 7. Western Ghats & Sri Lanka 20.2% |
| 8. Mesoamerica 19.3% |
| 9. Himalaya 19.2% |
| 10. Japan 19.1 % |
| 11. Mediterranean Basin 19% |
| 12. Guinean Forests of West Africa 17.7% |
| 13. Caribbean Islands 17.6% |
| 14. Coastal Forests of Eastern Africa 17.6% |
| 15. Eastern Afromontane 16.8% |
| 16. South Western Australia 16.4% |
| 17. Mountains of South West China 15.8% |
| 18. Philippines 15.2% |
| 19. New Caledonia 15.1% |
| 20. Madrean Pine-oak Woodlands 14.5% |
| 21. California Floristic Province 13.6% |
| 22. Indo-Burma 13.4% |
| 23. Tumbes-Choco-Magdalena 11.9% |
| 24. Cerrado 11% |
| 25. Maputaland Pondoland Albany 9.7% |
| 26. Polynesia-Micronesia 9.7% |
| 27. Sundaland 9.6 % |
| 28. Wallacea 9.5% |
| 29. Mountains of Central Asia 9.4% |
| 30. Madagascar & The Indian Ocean Islands 9% |
| 31. Caucasus 8.7% |
| 32. Atlantic Forests 8% |
| 33. Horn of Africa 7.7% |
| 34. Irano-Anatolian 4.8% |
| 35. East Melanesian Islands 2% |
1. Hotspots
Critical Ecosystem Partnership Fund, "The Biodiversity Hotspots," http://www.cepf.net/resources/hotspots/pages/default.aspx (accessed July 1, 2014). Data made available under the Creative Commons BY-SA 4.0 License: https://creativecommons.org/licenses/by-sa/4.0/legalcode.