Facts & Data
There are two useful pieces of information available here. The first titled Just the Facts is a summary of the key statistics and quantitative findings of this research. The second are the Performance Indices. Compiling information from an array of sources, the two Performance Indices provide a useful summation and rankings of how the hotspots and the nations which preside over them are performing in regards to environmental values.
Just the Facts
As of October 2016 and based on 2015 land use data
- Ecoregions comprising the world's ecosystem: 867
- Biological hotspots in the world: 36
- Nations in whose territory hotspots exist: 142
- Hotspots which have achieved Aichi target 11 of 17% protected area: 14
- Hotspots which have not reached Aichi target 11 of 17% protected area: 21
- Ecoregions in the world's hotspots: 391
- Ecoregions in hotspots that have achieved the Aichi target of 17% protected habitat within their own domain: 170
- Ecoregions with shortfalls from the 17% global target: 221
- Deadline for achieving 17% global protected area: 2020
- Cities with over 300K population in hotspots: 422
- Cities facing imminent conflicts between urban growth and biodiversity: 383
- Nations who are party to the Convention on Biological Diversity: 196
- Nations who are party, but not signatories to the Convention on Biological Diversity: 28
- Nations who have National Biodiversity Strategies and Action Plans (NBSAPs): 185
- Nations presiding over hotspots who have no National Biodiversity Strategies and Action Plans (NBSAPs): 3 (United States, Palestine and Kosovo)
- Nations presiding over hotspots whose National Biodiversity Strategies and Action Plans (NBSAPs) were published after 2010 and can therefore reflect the Aichi targets: 46/142
- Nations presiding over hotspots who do not have National Biodiversity Strategies and Action Plans (NBSAPs) that take into account the Aichi target 11 of securing 17% protected terrestrial area by 2020: 96
- Hotspot nations with publicly available spatial land-use plans for biodiversity: 16/142
Performance Indices
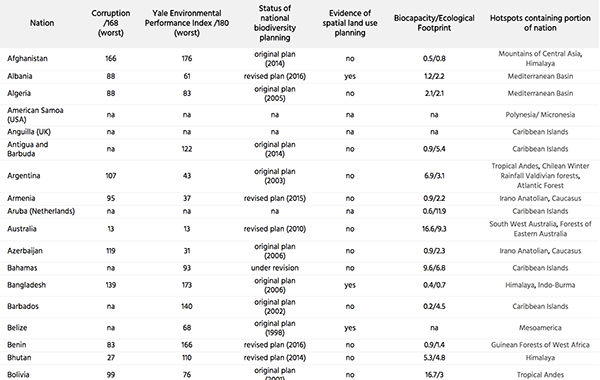
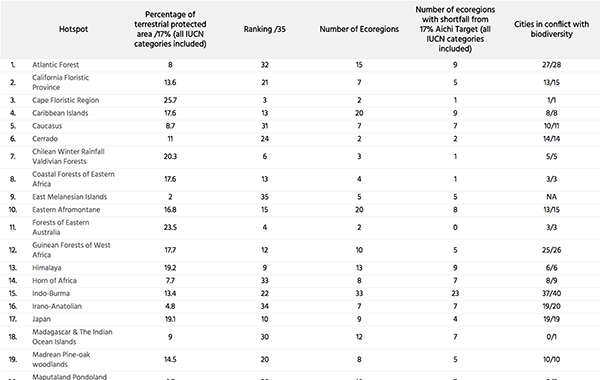
There are two performance indices. The first is the National Performance Index which documents the hotspot nations in regard to 1) perceptions of corruption, 2) environmental performance, 3) the status of national biodiversity planning, 4) evidence of spatial land use planning, and 5) national biocapacity and ecological footprints. The second is the Hotspot Performance Index which ranks the hotspots according to their percentage of protected area and notes the number of cities in each hotspot which are conflicting with biodiversity.
- The perception of corruption ranking is taken from a sample of 168 nations assessed by Transparency International's 2015 Corruption Perceptions Index. 1 The scoring system is 0 (most corrupt) – 100 (least corrupt).
- The national environmental performance ranking is based on the 2016 Environmental Performance Index (EPI) created by the Yale Center for Environmental Law and Policy, the Yale Data Driven Environmental Group, and the Colombia University Center of international Earth Science Information Network in collaboration with the Samuel Family Foundation, the McCall MacBain Foundation, and the World Economic Forum. 2 180 nations are ranked in the assessment. 1st (best) – 180th (worst).
- The status of national biodiversity planning indicates how nations are adhering to their commitment to the Convention on Biological Diversity to submit and regularly update National Biodiversity Strategy Actions Plans (NBSAPs). 3 National plans are categorized as revised plans, original plans, plans under revision, or plans in progress and are accompanied by the date of publication. NA indicates that the nation is either not a signatory to the Convention on Biological Diversity (USA for example) or information is unavailable and/or in the case of remote territories under the hegemony of other nations. For up to date NBSAP status reports the CBD website should be referred to.
- The assessment of whether a nation's National Biodiversity Strategy Actions Plan has any evidence of spatial planning is limited to desk top analysis. This factor is important in that it suggests the translation of words and targets into actual land use planning.
- National biocapacity and ecological footprints are taken from the Global Footprint Network. 4 Biocapacity is a "measure of the amount of biologically productive land and sea area available to provide the ecosystem services that humanity consumes". 5 Ecological footprints are a "measure of the demand populations and their activities place on the biosphere in a given year, given the prevailing technology and resource management." 6 The total footprint is reached by adding data for food, energy, forest products, urban area and waste.
- All other data pertaining to the percentage of terrestrial protected area, the number of ecoregions with a shortfall from Aichi Target 11 and cities in conflict with biodiversity are derived from our analysis.
1 Transparency International, "Corruption Perceptions Index 2015" https://www.transparency.org/cpi2015/ (accessed June 1, 2016).
2 A. Hsu, et al., 2016 Environmental Performance Index (New Haven, CT: Yale University, 2016). Available at http://epi.yale.edu/sites/default/files/2016EPI_Full_Report.pdf.
3 Convention on Biological Diversity, "National Biodiversity Strategies and Action Plans (NBSAPs)," https://www.cbd.int/nbsap/default.shtml (accessed Sep 1, 2016).
4 Global Footprint Network, "National Footprint Accounts 2016 are out! Carbon makes up 60% of world's Ecological Footprint," http://www.footprintnetwork.org/en/index.php/GFN/blog/national_footprint_accounts_2016_
carbon_makes_up_60_of_worlds_footprint (accessed ).
5 Michael Borucke, et al., "Accounting for demand and supply of the biosphere's regenerative capacity: The National Footprint Accounts' underlying methodology and framework," Ecological Indicators 24 (2012): 518-533.
6 Ibid.