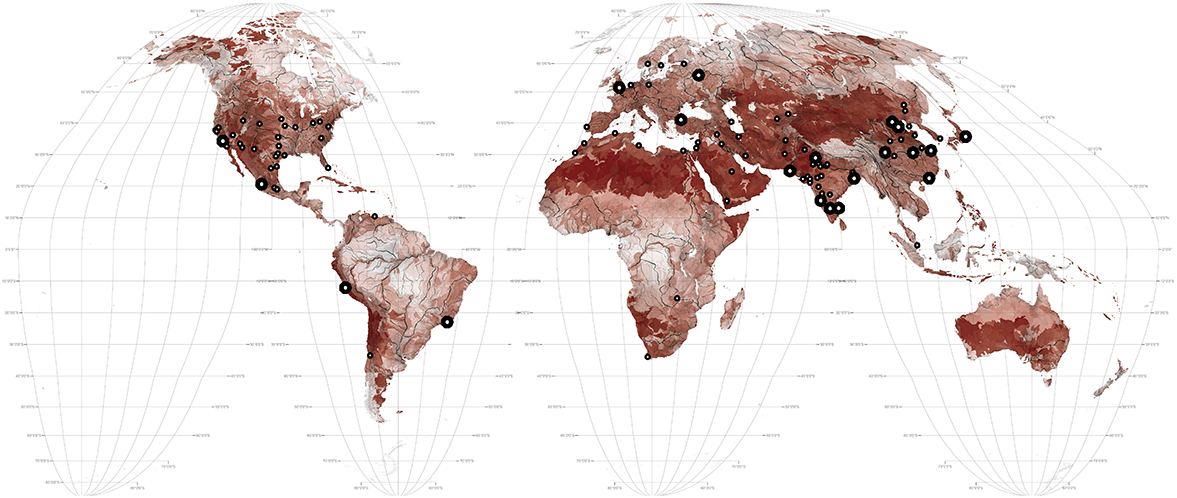


Whilst the United Nations reports that 2.1 billion people have gained access to improved water sanitation since 1990, 1.1 billion currently still lack easy access to fresh water. 1 268.5 million people live in cities with stressed water supplies due to geographical and/or financial limitations. Those cities are: Tokyo (37,800,000), Delhi (25,000,000), Shanghai (23,000,000), Mexico City (20,800,000), Beijing (19,500,000) Karachi (16,000,000), Kolkata (14,800,000), Istanbul (14,000,000), Rio de Janeiro (12,800,000), Los Angeles (12,300,000), Moscow (12,100,000), Chongqing (12,900,000), Tianjin (10,900,000), Shenzhen (10,700,000), London (10,200,000), Bangalore (9,700,000), Lima (9,700,000), Chennai (9,600,000), Hyderabad (8,700,000) and Wuhan (7,800,000). It is estimated that in order to produce enough food for a global 2050 population, water supplies will have to double. 2
There is plenty of water in the world but not always where settlements and farms are and not always in the form that we want it. Improved access to water can be achieved through less wasteful irrigation techniques (where 70% of all water is currently used), recycling grey and black water, altered consumption patterns and water sensitive urban design techniques which harvest storm water. Additionally, ocean water can be desalinated. As of mid-2015 there were 18,426 desalination plants across 150 countries supplying more than 300 million people with potable water. 3 Desalination plants are however extremely expensive and energy intensive.
1 United Nations Development Program, "Goal 6: Clean Water and Sanitation," http://www.undp.org/content/undp/en/home/sdgoverview/post-2015-development-agenda/goal-6.html (accessed September 9, 2016).
2 H. Décamps, "River networks as biodiversity hotlines," C. R. Biol. 334, no. 5-6 (2011): 420-434
3 International Desalination Association (IDA), "Desalination by the Numbers," http://idadesal.org/desalination-101/desalination-by-the-numbers/ (accessed September 9, 2016).
Map created by Richard Weller, Claire Hoch, and Chieh Huang using data/information from the following sources:
1. Fresh Water Access
World Resources Institute, "Aqueduct Water Risk Atlas" (2013), http://www.wri.org/resources/maps/aqueduct-water-risk-atlas (accessed October 11, 2014). Physical Risk Quantity map of the Interactive map was used.
2. Cities with Stressed Water Sources
Robert I. McDonald, et al., "Water on an urban planet: Urbanization and the reach of urban water infrastructure," Global Environmental Change 27 (2014): 96-105. Data made available under the Creative Commons Attribution-NonCommercial-ShareAlike 3.0 Unported License: https://creativecommons.org/licenses/by-nc-sa/3.0/legalcode.
3. Metropolis Populations
United Nations Department of Economic and Social Affairs Population Division, "World Population Prospects, the 2015 Revision," https://esa.un.org/unpd/wpp/Download/Standard/Population/ (accessed July 20, 2016).
4. Rivers
Natural Earth, "Rivers + Lake centerlines," http://www.naturalearthdata.com/downloads/10m-physical-vectors/10m-rivers-lake-centerlines/.