


The health of the world's waters is determined by myriad factors including, but not contained to, nitrogen, phosphorous, mercury and pesticide loading, sedimentation, thermal alteration, catchment and riparian zone deforestation, over-withdrawal of ground and surface water, over fishing, invasive species, flow modification, livestock density, wetland degradation and fragmentation, and unregulated storm water run-off and sewerage discharge.
The oceans are becoming more acidic due to increased rates of carbon dioxide dissolution. This in turn causes coral bleaching and negatively impacts food chains and calcification processes. In 2013, the World Resources Institute documented 762 coastal areas affected by nutrient overloading (run off from agricultural and urban landscapes) resulting in depleted oxygen, algae blooms and fish kills. There are now over 500 known 'dead zones' in the world's oceans. 1 20% of freshwater fish species became extinct or threatened with extinction in the last 50 years and between 50-70% the planet's wetlands have disappeared in the last 100 years. 2 According to the United Nations Development Program 80% of the world's polluted water is discharged directly without any treatment into rivers and seas. The world's rivers are subdivided with over 40,000 dams, cutting species migrations and radically altering habitats for the entire length of rivers. 3 Riparian habitat is severely depleted by adjacent agricultural production and ground and surface water is over extracted and returned to receiving environments polluted. Invasive species thrive in degraded riparian zones and waterways.
Improvements to water quality relate to land-use planning at the scale of catchments, agricultural run-off management, storm water management in urban areas, revegetation of riparian corridors and the treatment of industrial waste and domestic sewerage.
1 Oliver Morton, The Planet Remade: How Geoengineering Could Change the World (Princeton: Princeton University Press, 2015), 198
2 Nick C. Davidson, "How much wetland has the world lost? Long-term and recent trends in global wetland area," Marine and Freshwater Research 65, no. 10 (2014): 934-941.
3 H. Décamps, "River networks as biodiversity hotlines," C. R. Biol. 334, no. 5-6 (2011): 420-434.
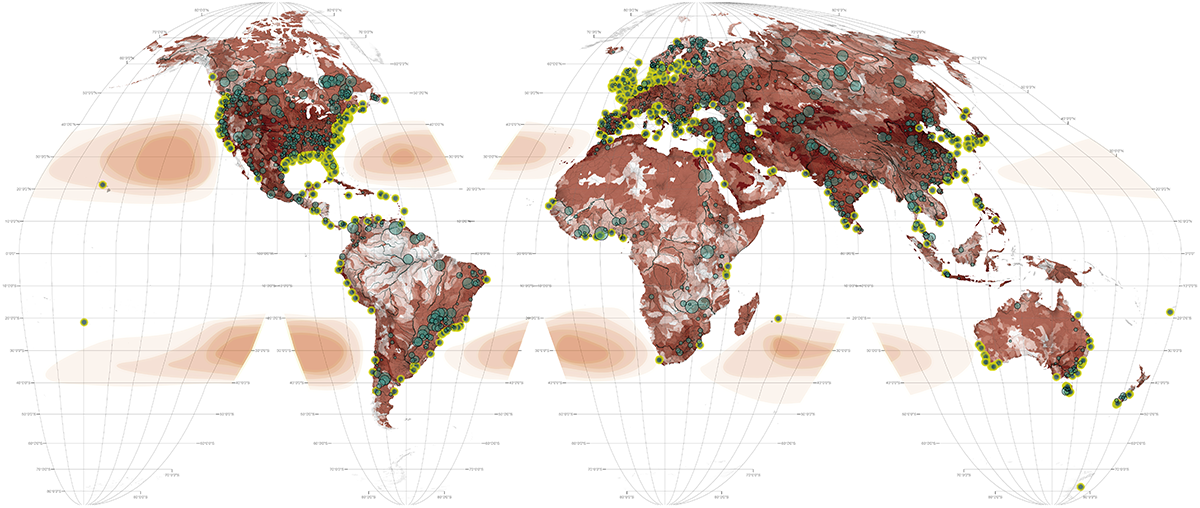
1. Freshwater Quality
World Resources Institute, "Aqueduct Water Risk Atlas" (2013), http://www.wri.org/resources/maps/aqueduct-water-risk-atlas (accessed October 11, 2014). Physical Risk Quality map of the Interactive map was used.
2. Garbage Gyres
Derived from Nikolai Maximenko & Jan Hafner, "Marine Debris," International Pacific Research Center (IPRC) 10, no. 2 (2010). Available at http://iprc.soest.hawaii.edu/news/marine_and_tsunami_debris/Marine_Debris_IPRC_Climate_Stories.pdf (accessed October 31, 2015).
3. Marine Dead Zones
World Resources Institute, "Eutrophication and Hypoxia Map Data Set" (2013), http://www.wri.org/resources/data-sets/eutrophication-hypoxia-map-data-set (accessed October 9, 2014).
4. Dams
B. Lehner, et al., "High resolution mapping of the world's reservoirs and dams for sustainable river flow management," Frontiers in Ecology and the Environment 9, no. 9 (2011). Source: GWSP Digital Water Atlas (2008). Map 81. GRanD Database (V1.0). Available at http://www.gwsp.org/products/grand-database.html.
5. Rivers
Natural Earth, "Rivers + Lake centerlines," http://www.naturalearthdata.com/downloads/10m-physical-vectors/10m-rivers-lake-centerlines/.